![]()
![]()
From the Futures tab, click the chart icon.
![]()
From Futures Overview, click the chart icon.
![]()
From Futures Detail, click chart.
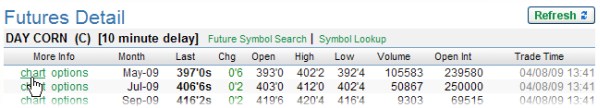
From Options Detail, click Chart.
Charts are available for most DTN Online contracts. Many analysis tools are provided with charts to help you make contract decisions.
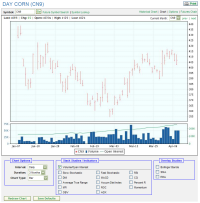
The chart is a static view of the data for the selected contract.
(Most quotes are delayed 10 to 30 minutes.)
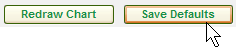
Click Redraw Chart at the bottom of the page or the browser Refresh button to update the data on the chart.
![]()
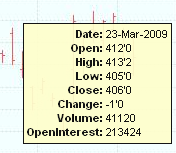
Move your cursor over the chart to view details about each quote plotted on the chart.
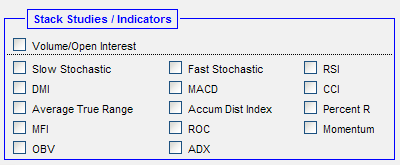
Click the box next to each analysis tool to add the tool to the chart.
(Click the box again to remove the analysis tool.)
Click Redraw Chart to view any changes you made. (The selected tools do not take effect until you click Redraw Chart.)
![]()
All options can be turned on or off except for quotes. Quotes are always on.
See Static Charts Tools to learn more about analysis tools available for charts.
Select the frequency quotes are displayed on the chart from the Interval pull down menu.
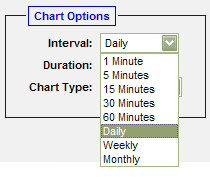
Select the period of time the graph covers from the Duration pull down menu.
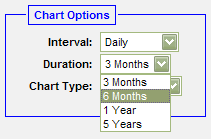
Choose the style of graph used to display the quotes from Chart Type.
Three options are available: Bar, Candlestick, and Line.

See Chart Types to learn more about chart features.
Click Redraw Chart to view any changes you made. (The changes you make do not take effect until you click Redraw Chart.)
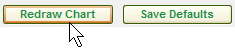
To make the current chart settings the default, click Save Defaults.
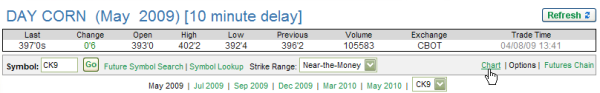
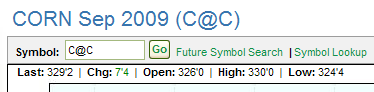
To quickly access another chart, enter the symbol for the contract in the Symbol box located above the chart and click Go.
![]()
To generate a continuous chart, enter the symbol for the contract in the Symbol box followed by @C. Click Go to create the chart.
For example, a continuous chart for Corn would be entered as:
C@C
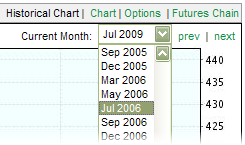
Select another contract symbol from the Current Month drop down menu.
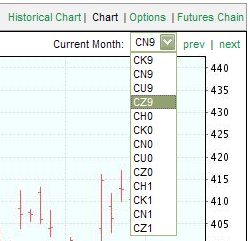
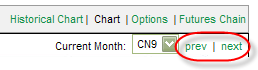
Click prev to view the chart for the previous contract.
Click next to view the chart for the next closest contract.
Click Historical Chart to view trends and averages from previous months.
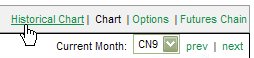
From Historical Chart, select the month and year from the Current Month drop down menu.
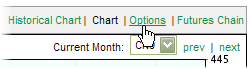
Click Options to access Options Detail.
Click Futures Chain to access Futures Detail.
![]()
|
|