![]()
![]()
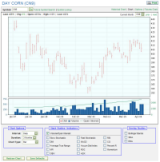
The following chart types are available:

A bar chart represents the high, low, open, and close values for each time interval you selected.
The length of the bar represents the spread of values for the day.
![]()
The highest value is at the top.
![]()
The lowest value is at the bottom.
![]()
The open price is indicated on the left.
![]()
The close price is indicated on the right.
![]()
A candlestick chart represents the high, low, open, and close values for each time interval you selected.
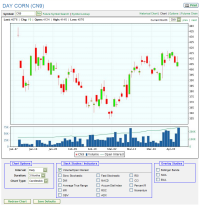
The length of the bar represents the spread of values for the day.

The spread between open and close values are within the box.

The highest value is at the top.
![]()
The lowest value is at the bottom.
![]()
If the open is lower than the close, the box is shaded green.
![]()
If the open was higher than the close, the box is shaded red.
![]()
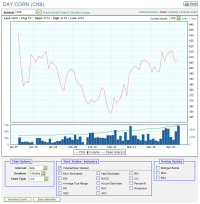
A line chart plots one quote on a line.
The value represented on the line varies depending on other options you selected.
Typically the values are the closing price for the day (longer-interval chart) or the value at the specific time (shorter-interval chart).
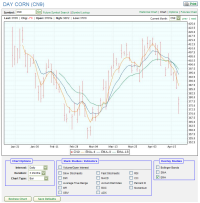
The following studies are available to add to your chart.
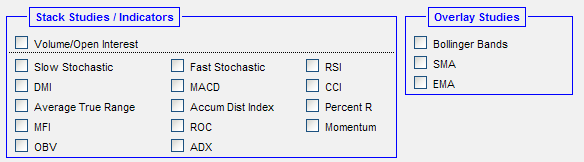
Select a study from the list to add the study to your chart.
Click again to remove the study from your chart.
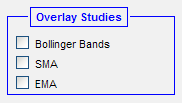
Selecting an overlay study displays additional analysis within the main chart.
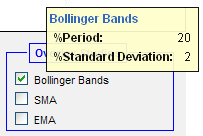
Bollinger Bands is an indicator that allows users to compare volatility and relative price levels over a period of time. The distance between bands widens during a period of rising price volatility. The distance contracts during a period of low market volatility.
Upper line is two standard deviations above the simple moving average.
Middle line is a simple moving average.
Lower line is two standard deviations below the simple moving average.
![]()
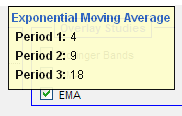
Exponential Moving Average gives greater weight to more recent data. Less recent data receives progressively less weight.
EMA smooths moving average (which lags the market).
The period is the number of time intervals used to create the average.
![]()
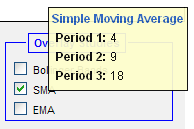
Simple Moving Average gives equal weight to each day's price data.
Moving average lags the market.
The period is the number of time intervals used to create the average.
![]()
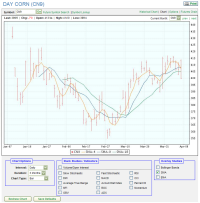
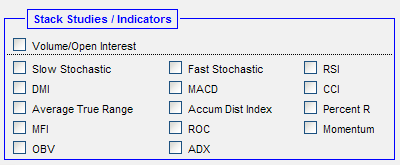
Selecting a stack study displays additional analysis below the main chart.
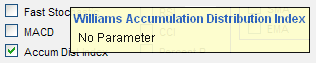
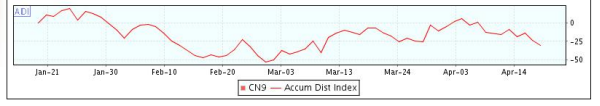
The Williams Accumulation / Distribution Index adds or subtracts each day's volume in proportion to where the close is between the day's high and low to show how money may be flowing into or out of a stock.
Measures the volume force behind a move.
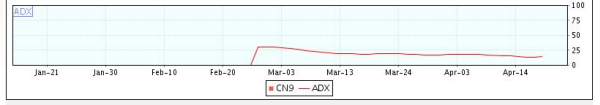
The Average Directional Index oscillator evaluates the strength of a current trend, up or down.
ADX is the moving (smoothed) average based on the spread between +DI and -DI lines from the Directional Movement Indicator on a scale of 0 to 100.
Low readings (below 20) indicate a weak trend.
High readings (above 40) indicate a strong trend.
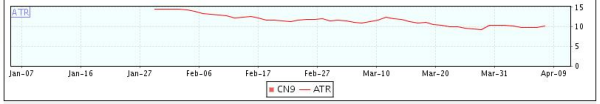
The Average True Range indicator measures a security's volatility.
ATR is designed with commodities and daily prices in mind.
Large or increasing ranges suggest traders are prepared to continue to bid up or sell down a stock through the course of the day.
Decreasing range suggests waning interest.
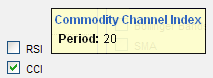
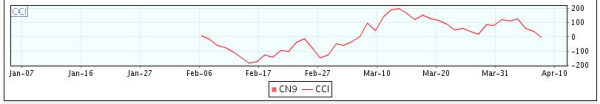
The Commodity Channel Index indicator is a momentum oscillator designed to identify cyclical turns in commodities.
CCI quantifies the relationship between the asset's typical price, a moving average of the asset's typical price, and normal deviations from that average.
CCI below -100 may indicate oversold levels.
CCI exceeding +100 may indicate overbought levels.
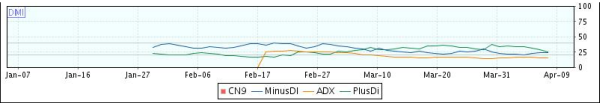
The Directional Movement Indicator indicates whether the values are trending or not.
The plus DI line measures buying pressure.
The minus DI line measures selling pressure.
The Average Directional Index (ADX) line is based on the spread between the +DI and -DI lines.
The value is calculated over 14 periods.

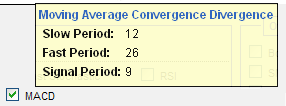
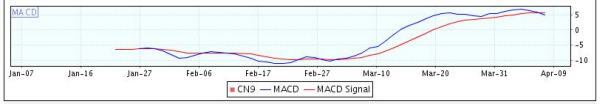
The Moving Average Convergence/Divergence indicator displays the difference between two exponentially smoothed moving averages of closing prices.
The momentum oscillator is created by subtracting the slower (26 day) exponential moving average from the faster (12 day) exponential moving average.
The MACD Signal line is the 9-day exponential moving average.
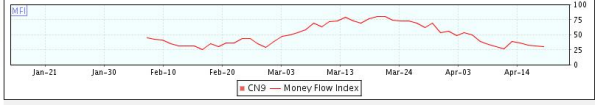
The Money Flow Index momentum indicator is similar to Relative Strength Index (RSI).
MFI is volume-weighted and a good measure of the strength of money flowing in and out of a security.
MFI can signal divergences and overbought/oversold conditions.
A value of 80 is considered overbought.
A value of 20 is considered oversold.

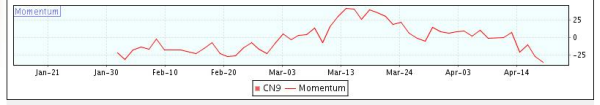
Momentum is a leading indicator measuring a security's rate-of-change.
To calculate momentum, price at a fixed interval is subtracted from the current price.
The indicator remains positive while an up trend is sustained.
The indicator remains negative while a down trend is sustained.

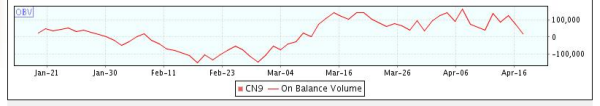
On Balance Volume measures positive and negative volume flow from the concept that volume precedes price.
When the close is up (demand volume), the daily volume is added to the previous day's on-balance volume figure.
When the close is down (supply volume), the daily volume is subtracted from the previous day's on-balance volume figure.
Generally used to confirm price moves.
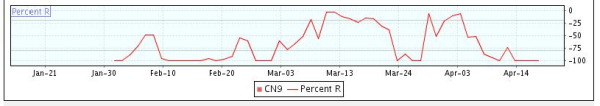
The Williams %R momentum indicator works much like the Stochastic Oscillator.
Popular for measuring overbought and oversold levels.
Shows the relationship of the close relative to the high-low range over a number of periods.
If the close equals the high of the high-low range, the indicator is 0.
If the close equals the low of the high-low range, the result is -100.
0 to -20 is considered overbought.
-80 to -100 is considered oversold.
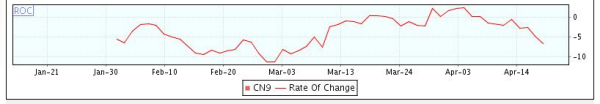
The Rate of Change indicator is a momentum oscillator that measures the percent change in price from one period to the next.
Fluctuates above and below the zero line as the rate-of-change moves from positive to negative.
The indicator remains positive while an up trend is sustained.
The indicator remains negative while a down trend is sustained.
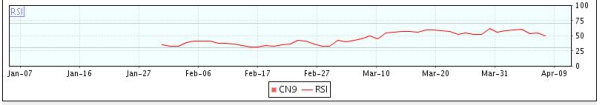
The Relative Strength Index momentum oscillator is a measure of how fast the directional price is moving.
The averages of the closes that were up and the closes that were down over a specific period indicate how much strength is left in a trend.
Up days are characterized by the daily close being higher than yesterday's daily close.
A down day is characterized by the close being lower than the previous day's daily close.
A value of 70 or greater indicates the market is overbought.
A value of 30 or less indicates the market is oversold.
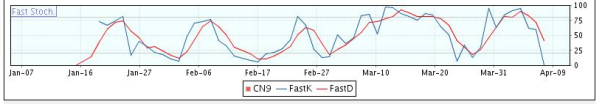
The standard fast stochastic oscillator is a highly reactive momentum indicator.
The stochastic oscillator is based on the expectation that closing prices typically occur at the upper end of the range when prices are rising and at the lower end of the range when prices are falling.
The %K line indicates where closing prices are in relation to the total price range displayed as a percentage.
A high %K (above 70) indicates a closing price near the top of the range.
A low %K (below 30) indicates a closing price near the bottom of the range.
The %D line is a smoothed version (moving average) of the %K line.
Transaction signals can be spotted when the stochastic oscillator crosses its moving average.

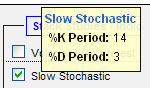
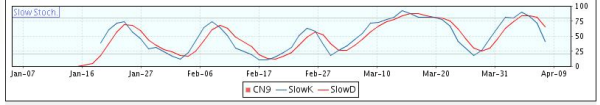
The slow study slows down the reactions somewhat, eliminating some spurious movements.
The stochastic oscillator is based on the expectation that closing prices typically occur at the upper end of the range when prices are rising and at the lower end of the range when prices are falling.
The %K line indicates where closing prices are in relation to the total price range displayed as a percentage.
A high %K (above 70) indicates a closing price near the top of the range.
A low %K (below 30) indicates a closing price near the bottom of the range.
The %D line is a smoothed version (moving average) of the %K line.
Transaction signals can be spotted when the stochastic oscillator crosses its moving average.
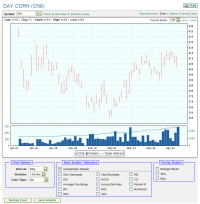
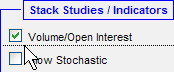
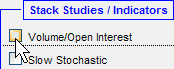
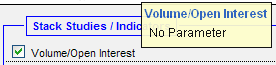
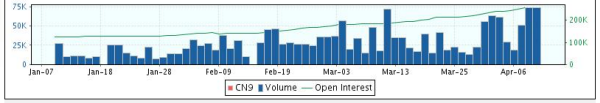
Volume and open interest are shown below the main chart.
Volume (bar) is the number of trades over a period of time.
Open Interest (line) is the number of options or futures contracts that are still unliquidated at the end of a trading day.
|
|