![]()
![]()
![]()
![]()
|
|
|
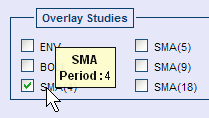
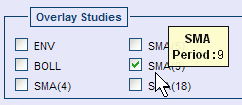
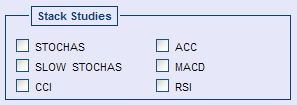
The following studies are available to add to your chart.
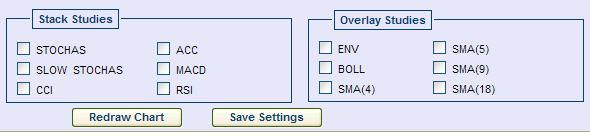
Select a study from the list to add the study to your chart.
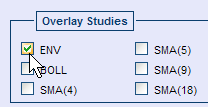
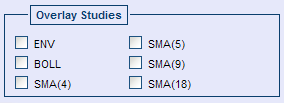
Click again to remove the study from your chart.

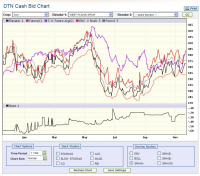
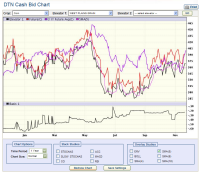
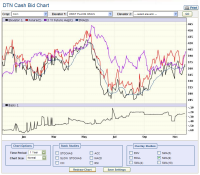
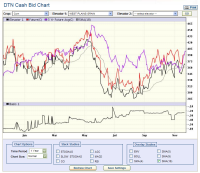
Selecting an overlay study displays additional analysis within the main chart.
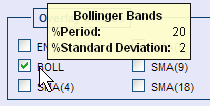
Bollinger Bands is an indicator that allows users to compare volatility and relative price levels over a period of time. The distance between bands widens during a period of rising price volatility. The distance contracts during a period of low market volatility.
Upper line is two standard deviations above the simple moving average.
Middle line is a simple moving average.
Lower line is two standard deviations below the simple moving average.
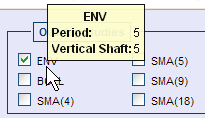
Envelope displays a percent band above and below the moving average. This indicates the trading range.
Typically the analyst implements trading strategies above and below
these values.
A moving average over 5 time intervals is calculated with a 5 percent up
or down amplification to create of the envelope.
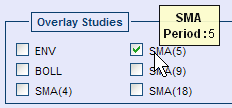
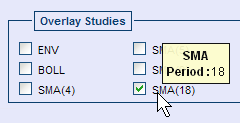
Simple Moving Average gives equal weight to each day's price data.
Moving average lags the market.
The period is the number of time intervals used to create the average.
Selecting a stack study displays additional analysis below the main chart.
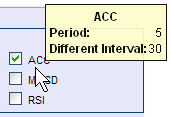
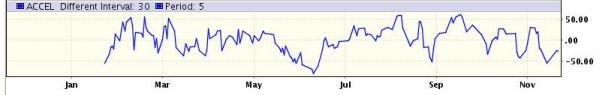
Acceleration indicates the rate of change in momentum in a series of prices. A rising value indicates prices are rising at a faster rate.
The acceleration is calculated by taking the current momentum and subtracting
the value from a period a specific interval back.
The value is calculated with a base of momentum of five periods and 30
intervals between the current momentum and past value.
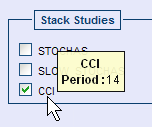
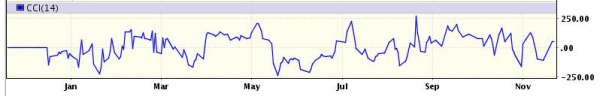
The Commodity Channel Index indicator is a momentum oscillator designed to identify cyclical turns in commodities.
CCI quantifies the relationship between the asset's typical price, a moving average of the asset's typical price, and normal deviations from that average.
CCI below -100 may indicate oversold levels.
CCI exceeding +100 may indicate overbought levels.
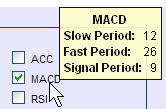
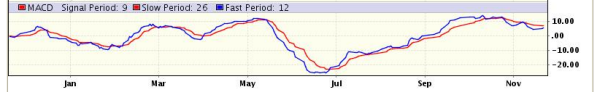
The Moving Average Convergence/Divergence indicator displays the difference between two exponentially smoothed moving averages of closing prices.
The momentum oscillator is created by subtracting the slower (26 day) exponential moving average from the faster (12 day) exponential moving average.
The MACD Signal line is the 9-day exponential moving average.
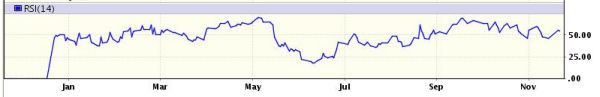
The Relative Strength Index momentum oscillator is a measure of how fast the directional price is moving.
The averages of the closes that were up and the closes that were down over a specific period indicate how much strength is left in a trend.
Up days are characterized by the daily close being higher than yesterday's daily close.
A down day is characterized by the close being lower than the previous day's daily close.
A value of 70 or greater indicates the market is overbought.
A value of 30 or less indicates the market is oversold.
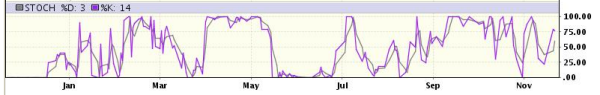
The standard fast stochastic oscillator is a highly reactive momentum indicator.
The stochastic oscillator is based on the expectation that closing prices typically occur at the upper end of the range when prices are rising and at the lower end of the range when prices are falling.
The %K line indicates where closing prices are in relation to the total price range displayed as a percentage.
A high %K (above 70) indicates a closing price near the top of the range.
A low %K (below 30) indicates a closing price near the bottom of the range.
The %D line is a smoothed version (moving average) of the %K line.
Transaction signals can be spotted when the stochastic oscillator crosses its moving average.
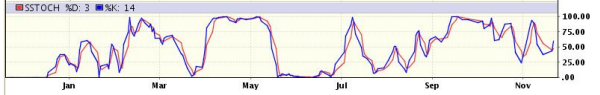
The slow study slows down the reactions somewhat, eliminating some spurious movements.
The stochastic oscillator is based on the expectation that closing prices typically occur at the upper end of the range when prices are rising and at the lower end of the range when prices are falling.
The %K line indicates where closing prices are in relation to the total price range displayed as a percentage.
A high %K (above 70) indicates a closing price near the top of the range.
A low %K (below 30) indicates a closing price near the bottom of the range.
The %D line is a smoothed version (moving average) of the %K line.
Transaction signals can be spotted when the stochastic oscillator crosses its moving average.
|
|