![]()
![]()
![]()
![]()
|
|
|
Click on a data point in My DTN Cash Bids

to access DTN Cash Bid Chart.
From My DTN Cash Bids, click Go to Cash Bid Chart.

If data has not been previously selected, select Crop.
Select elevator 1.
Select elevator 2 (optional).

Once your selections have been completed, click Go.
Once the chart displays, you can change the display any time by selecting a different crop and elevator. Then click Go to redraw the chart.
A description of chart data is shown in the legend.
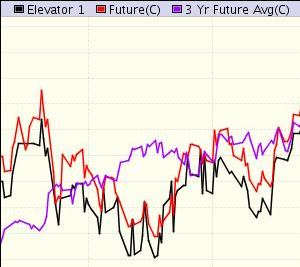
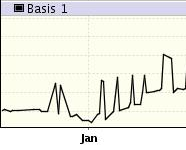
Click Redraw Chart at the bottom of the page or the browser Refresh button to update the data on the chart.

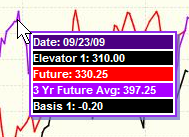
Move your cursor over the chart to view details about each quote plotted on the chart.
Click the box next to each analysis tool to add the tool to the chart.
(Click the box again to remove the analysis tool.)
Click Redraw Chart to view any changes you made. (The selected tools do not take effect until you click Redraw Chart.)
All options can be turned on or off except for quotes.
See DTN Cash Bid Chart Tools to learn more about analysis tools available for bid analyzer charts.

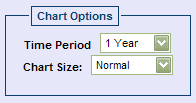
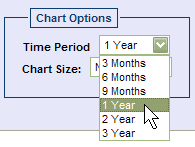
Select the period of time the graph covers from the Time Period pull down menu.
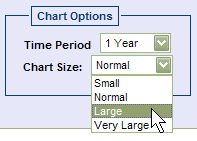
Select the desired size from the Chart Size pull down menu.
Click Redraw Chart to view any changes you made. (The changes you make do not take effect until you click Redraw Chart.)

To make the current chart settings the default, click Save Settings.
