![]()
![]()
To access Interactive Charts select
DTN Instant > Charts
![]()
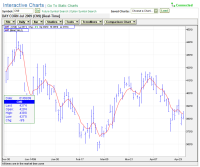
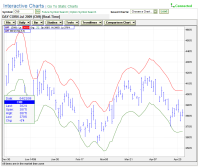
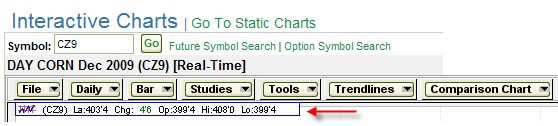
Interactive charts help you monitor price trends for futures and options contracts. Streaming data updates the chart as the market moves.
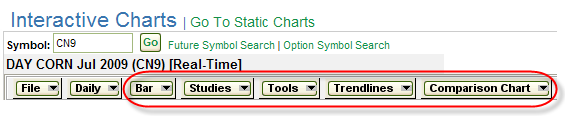
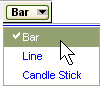
The following chart styles are available:
A bar chart represents the high, low, open, and close values for each time interval you selected.
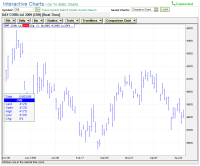
The length of the bar represents the spread of values for the day.
![]()
The highest value is at the top.
![]()
The lowest value is at the bottom.
![]()
The open price is indicated on the left.
![]()
The close price is indicated on the right.
![]()
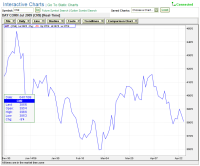
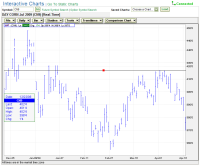
A line chart plots one quote on a line.
The value represented on the line varies depending on other options you selected.
Typically the values are the closing price for the day (longer-interval chart) or the value at the specific time (shorter-interval chart).
A candlestick chart represents the high, low, open, and close values for each time interval you selected.
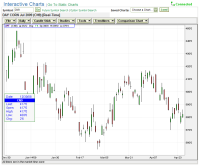
The length of the bar represents the spread of values for the day.
![]()
The highest value is at the top.
![]()
The lowest value is at the bottom.
![]()
The spread between open and close values are within the box.
![]()
If the open is lower than the close, the box is shaded green.
![]()
If the open was higher than the close, the box is shaded red.
![]()
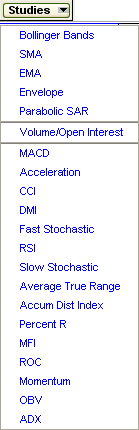
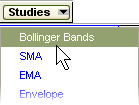
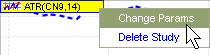
The following studies are available to add to your chart.
Select a study from the drop down list to add the study to your chart.
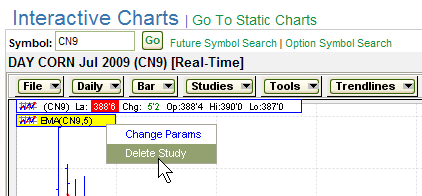
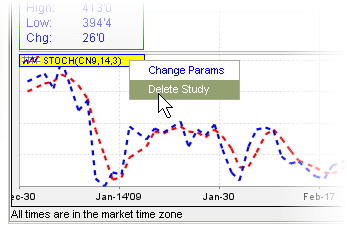
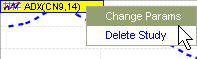
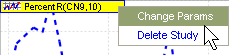
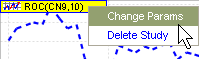
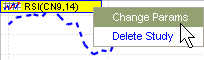
To delete a single study right click on the study label and select Delete Study.
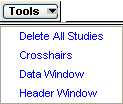
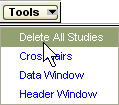
Select Delete All Studies from the Tools drop down list to remove all studies from the chart.
Selecting an overlay study displays additional analysis within the main chart.
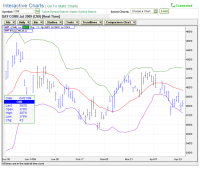
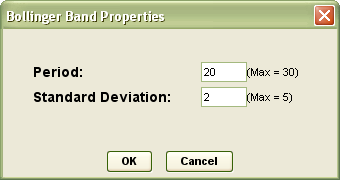
Bollinger Bands is an indicator that allows users to compare volatility and relative price levels over a period of time. The distance between bands widens during a period of rising price volatility. The distance contracts during a period of low market volatility.
Upper line is two standard deviations above the simple moving average.
Middle line is a simple moving average.
Lower line is two standard deviations below the simple moving average.
Right click on the study label
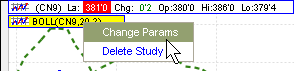
to change study parameters.
Exponential Moving Average gives greater weight to more recent data. Less recent data receives progressively less weight.
EMA smooths moving average (which lags the market).
The period is the number of time intervals used to create the average.
Right click on the study label
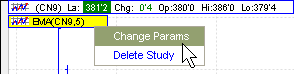
to change study parameters.

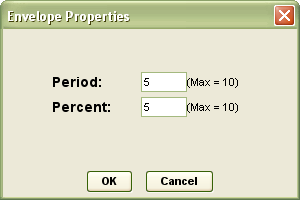
Envelope displays a percent band above and below the moving average. This indicates the trading range.
Typically the analyst implements trading strategies above and below
these values.
A moving average over 5 time intervals is calculated with a 5 percent up
or down amplification to create of the envelope.
Right click on the study label
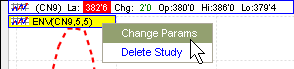
to change study parameters.
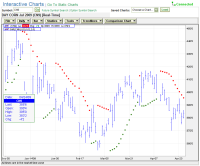
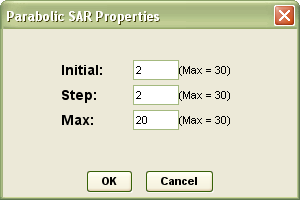
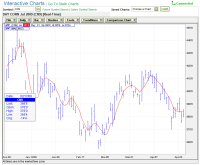
The Parabolic Stop and Reverse (SAR) is a trend following method.
As soon as the trade is initiated, it allows time for the market to respond to the change in trend. As the trend gets underway the stop evolves with the market.
In an uptrend, the SAR appears below the price and converges upwards.
On a downtrend, the SAR appears above the price and converges downwards.
Right click on the study label
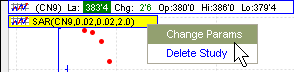
to change study parameters.
Simple Moving Average gives equal weight to each day's price data.
Moving average lags the market.
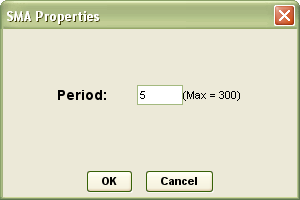
The period is the number of time intervals used to create the average.
Right click on the study label
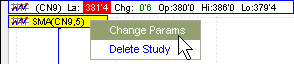
to change study parameters.
Selecting a stack study displays additional analysis below the main chart.
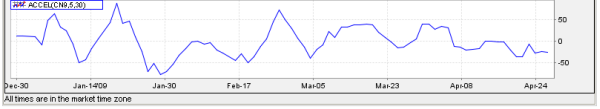
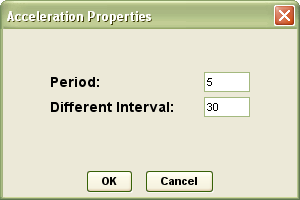
Acceleration indicates the rate of change in momentum in a series of prices. A rising value indicates prices are rising at a faster rate.
The acceleration is calculated by taking the current momentum and subtracting
the value from a period a specific interval back.
The value is calculated with a base of momentum of five periods and 30
intervals between the current momentum and past value.
Right click on the study label
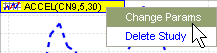
to change study parameters.
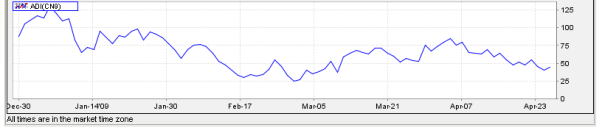
The Williams Accumulation-Distribution Index combines price and volume to show how money may be flowing into or out of a stock.
Measures the volume force behind a move.
![]()
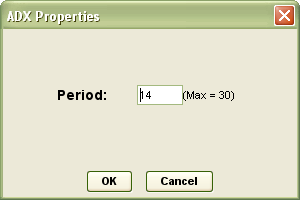
The Average Directional Index oscillator evaluates the strength of a current trend, up or down.
ADX is the moving (smoothed) average based on the spread between +DI and -DI lines from the Directional Movement Indicator on a scale of 0 to 100.
Low readings (below 20) indicate a weak trend.
High readings (above 40) indicate a strong trend.
![]()
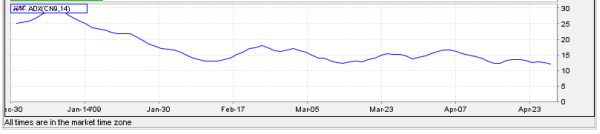
Right click on the study label
to change study parameters.
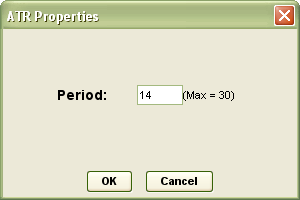
The Average True Range indicator measures a security's volatility.
ATR is designed with commodities and daily prices in mind.
![]()
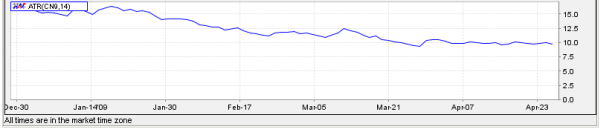
Right click on the study label
to change study parameters.
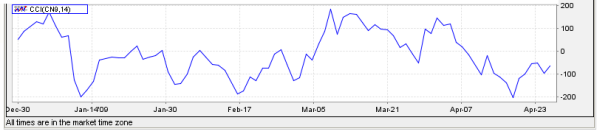
The Commodity Channel Index indicator is a momentum oscillator designed to identify cyclical turns in commodities.
CCI quantifies the relationship between the asset's typical price, a moving average of the asset's typical price, and normal deviations from that average.
CCI below -100 may indicate oversold levels.
CCI exceeding +100 may indicate overbought levels.
Right click on the study label
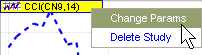
to change study parameters.

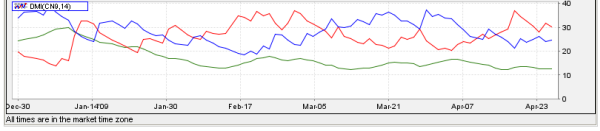
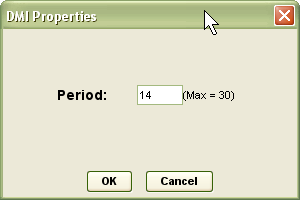
The Directional Movement Index indicates whether the values are trending or not.
Values are provided on a scale of 0 to 100.
The value is calculated over 14 periods which is the range of the user's market cycle.
Right click on the study label
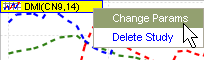
to change study parameters.
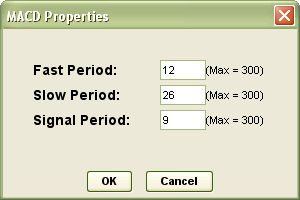
The Moving Average Convergence/Divergence indicator displays the difference between two exponentially smoothed moving averages of closing prices.
The momentum oscillator is created by subtracting the slower (26 day) exponential moving average from the faster (12 day) exponential moving average.
The MACD Signal line is the 9-day exponential moving average.
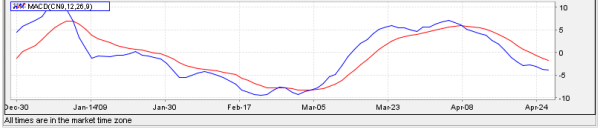
Right click on the study label
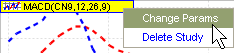
to change study parameters.
The Money Flow Index momentum indicator is similar to Relative Strength Index (RSI).
MFI is volume-weighted and a good measure of the strength of money flowing in and out of a security.
MFI can signal divergences and overbought/oversold conditions.
![]()
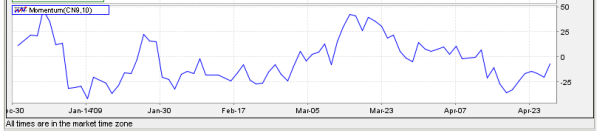
Momentum is a leading indicator measuring a security's rate-of-change.
To calculate momentum, price at a fixed interval is subtracted from the current price.
The indicator remains positive while an uptrend is sustained.
The indicator remains negative while a downtrend is sustained.
![]()
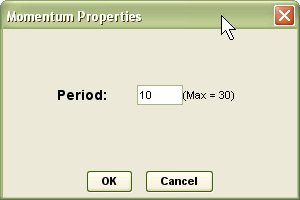
Right click on the study label
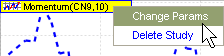
to change study parameters.
On Balance Volume measures positive and negative volume flow from the concept that volume precedes price.
When the close is up (demand volume), the daily volume is added to the previous day's on-balance volume figure.
When the close is down (supply volume), the daily volume is subtracted from the previous day's on-balance volume figure.
Generally used to confirm price moves.
![]()
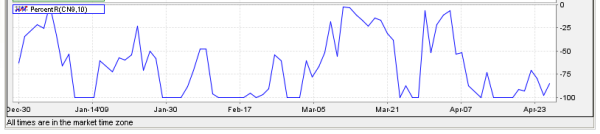
The Williams %R momentum indicator works much like the Stochastic Oscillator.
Popular for measuring overbought and oversold levels.
Shows the relationship of the close relative to the high-low range over a number of periods.
If the close equals the high of the high-low range, the indicator is 0.
If the close equals the low of the high-low range, the result is -100.
0 to -20 is considered overbought.
-80 to -100 is considered oversold.
![]()
Right click on the study label
to change study parameters.

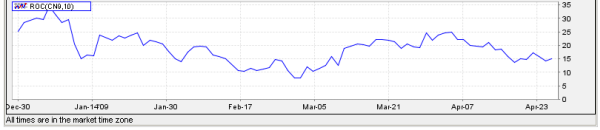
The Rate of Change indicator is a momentum oscillator that measures the percent change in price from one period to the next. Fluctuates above and below the zero line as the rate-of-change moves from positive to negative.
![]()
Right click on the study label
to change study parameters.

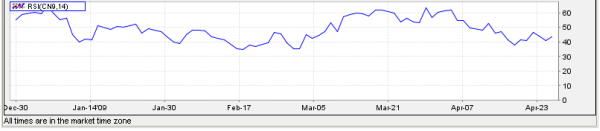
The Relative Strength Index momentum oscillator is a measure of how fast the directional price is moving.
The averages of the closes that were up and the closes that were down over a specific period indicate how much strength is left in a trend.
Up days are characterized by the daily close being higher than yesterday's daily close.
A down day is characterized by the close being lower than the previous day's daily close.
A value of 70 or greater indicates the market is overbought.
A value of 30 or less indicates the market is oversold.
Right click on the study label
to change study parameters.

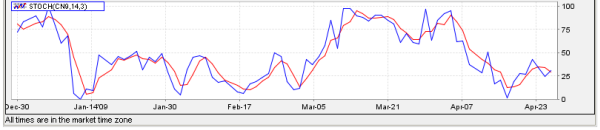
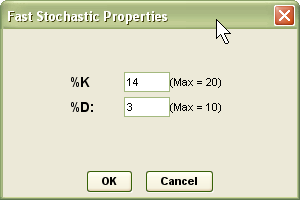
The standard fast stochastic oscillator is a highly reactive momentum indicator.
The stochastic oscillator is based on the expectation that closing prices typically occur at the upper end of the range when prices are rising and at the lower end of the range when prices are falling.
The %K line indicates where closing prices are in relation to the total price range displayed as a percentage.
A high %K (above 70) indicates a closing price near the top of the range.
A low %K (below 30) indicates a closing price near the bottom of the range.
The %D line is a smoothed version (moving average) of the %K line.
Transaction signals can be spotted when the stochastic oscillator crosses its moving average.
Right click on the study label
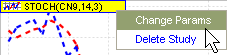
to change study parameters.
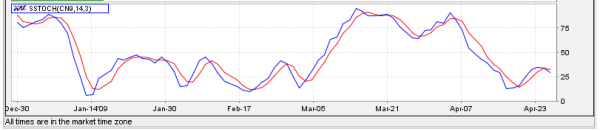
The slow study slows down the reactions somewhat, eliminating some spurious movements.
The stochastic oscillator is based on the expectation that closing prices typically occur at the upper end of the range when prices are rising and at the lower end of the range when prices are falling.
The %K line indicates where closing prices are in relation to the total price range displayed as a percentage.
A high %K (above 70) indicates a closing price near the top of the range.
A low %K (below 30) indicates a closing price near the bottom of the range.
The %D line is a smoothed version (moving average) of the %K line.
Transaction signals can be spotted when the stochastic oscillator crosses its moving average.
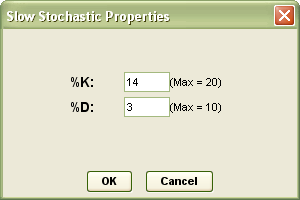
Right click on the study label
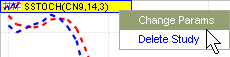
to change study parameters.
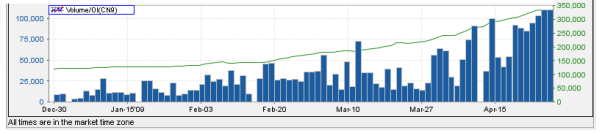
Volume and open interest are shown below the main chart.
Volume (bar) is the number of trades over a period of time.
Open Interest (line) is the number of options or futures contracts that are still unliquidated at the end of a trading day.
![]()
The following actions are available from the Tools option:
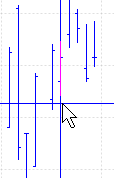
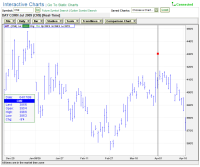
Select Crosshairs from the Tools drop down list.
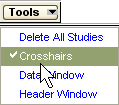
Drag your cursor across the chart to place the crosshairs into the desired position.
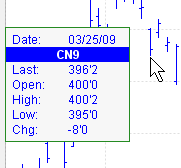
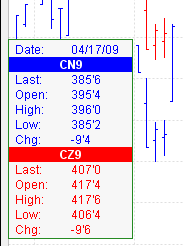
Select Data Window from the Tools drop down list
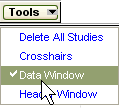
to turn the data window on and off.
Select Header Window from the Tools drop down list
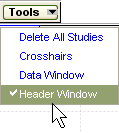
to turn the header window on and off.
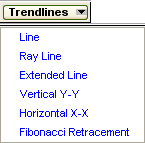
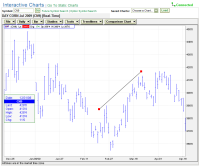
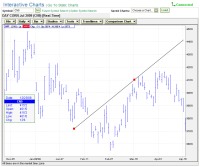
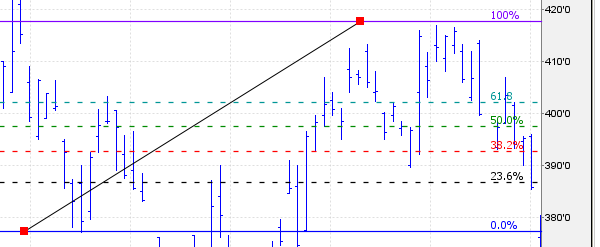
Trendlines can be added to help you better visualize trends.
Select a style from the drop down menu.
Move your cursor over the chart to the starting point for the line.
Click and hold the mouse button down.
Drag to the ending point and release the mouse button. The line will appear.
Click the line you created.
When the red squares appear, click and drag the mouse to adjust the line.
To remove the line, right-click the line and select Delete Trendline.
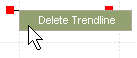
Or select the line and click Delete on your keyboard.
The following trendline styles are available:
Draw line with two points.
Draw line by setting the starting point and angle. The line will extend from the starting point out to the edge of the chart.
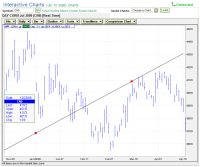
Draw a line that will extend from one side of the chart to the other.
Draw a vertical line that extends from one end of the chart to the other.
Draw a horizontal line that extends from one end of the chart to the other.
Stretch the line to the desired position.
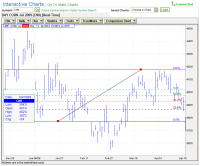
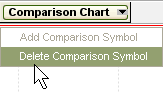
Turns comparison data on and off.
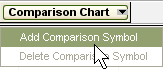
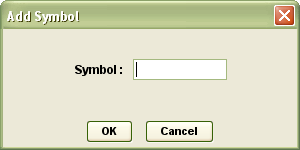
Enter the symbol you want to compare to the current one and click OK.
The chart shows data together for comparison.
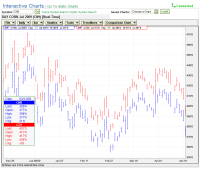
The original symbol data is shown in blue.
The second symbol data is shown in red.
Select Delete from the menu to remove the second data set.
|
|